Busybee Automation is a smart automation dashboard targeting multi-family communitiest. Their newest feature is a sensor that will continuously monitor radon levels in the resident’s homes. The Radon Dashboard visually displays radon levels, analytics, and reports for property staff.
The Challenge
Radon Natural Gas Levels are a relatively unknown concern across multifamily state boards. How can we accurately and visually portray this complicated data in a way users will be able to easily understand at-a-glance?
My Role
My role was to design a dashboard utilizing the brand guidelines from the existing automation dashboard already being used by their clients. We needed a fresh look that was inspired by the original dashboard design so users already have a base understanding of how this new product will function.
Research
An understanding of Radon and what multi-family properties need to know/report
Visual Design
Visual design systems, data visualization and report templates
Team Lead
Team lead for the design team and point of contact for developers
Prototyping
Headed up all prototyping for the app using Figma
Research
Secondary Research
What is Radon and why is it a concern? Radon is an invisible gas that comes from naturally occurring radon in the soil. It gets into residents’ apartments through cracks in the slabs and walls, the expansion joints between floor and walls, porous concrete block walls, open sump pits, crawlspaces, and openings.
It is the #1 cause of lung cancer for non-smokers! Protecting your residents requires consistent testing, especially since 90% of your resident’s time, according to the EPA, is now spent indoors due to more remote working situations and online schooling. Monitoring Radon levels and indoor air quality is crucial to residents’ well-being since the concentrations of some pollutants are often 2 to 5 times higher than typical outdoor concentrations.
Research
1:1 Interviews
We interviewed ten multi-family property managers to get a better insight into their frustrations. Almost all of the managers expressed frustrations with the cost and time required to meet their monthly mandated radon reports.
" Coordinating with residents to allow entry for radon technicians every month is a nightmare."
Property Managers in some states are required to submit radon level reports every one to three months. The average cost of a professional radon inspection is upwards of $428 per building. The tests used by certified radon technicians don’t even monitor radon levels continuously.
Of PMs don't fully understand the reports
0%
Is how long technicians test for Radon
0hrs
Based on this research, these are some of the key features we included:
Having continuous data points can help judge whether or not there was an unusual occurrence during the short-term test that might invalidate the overall measurement.
Visualized Data
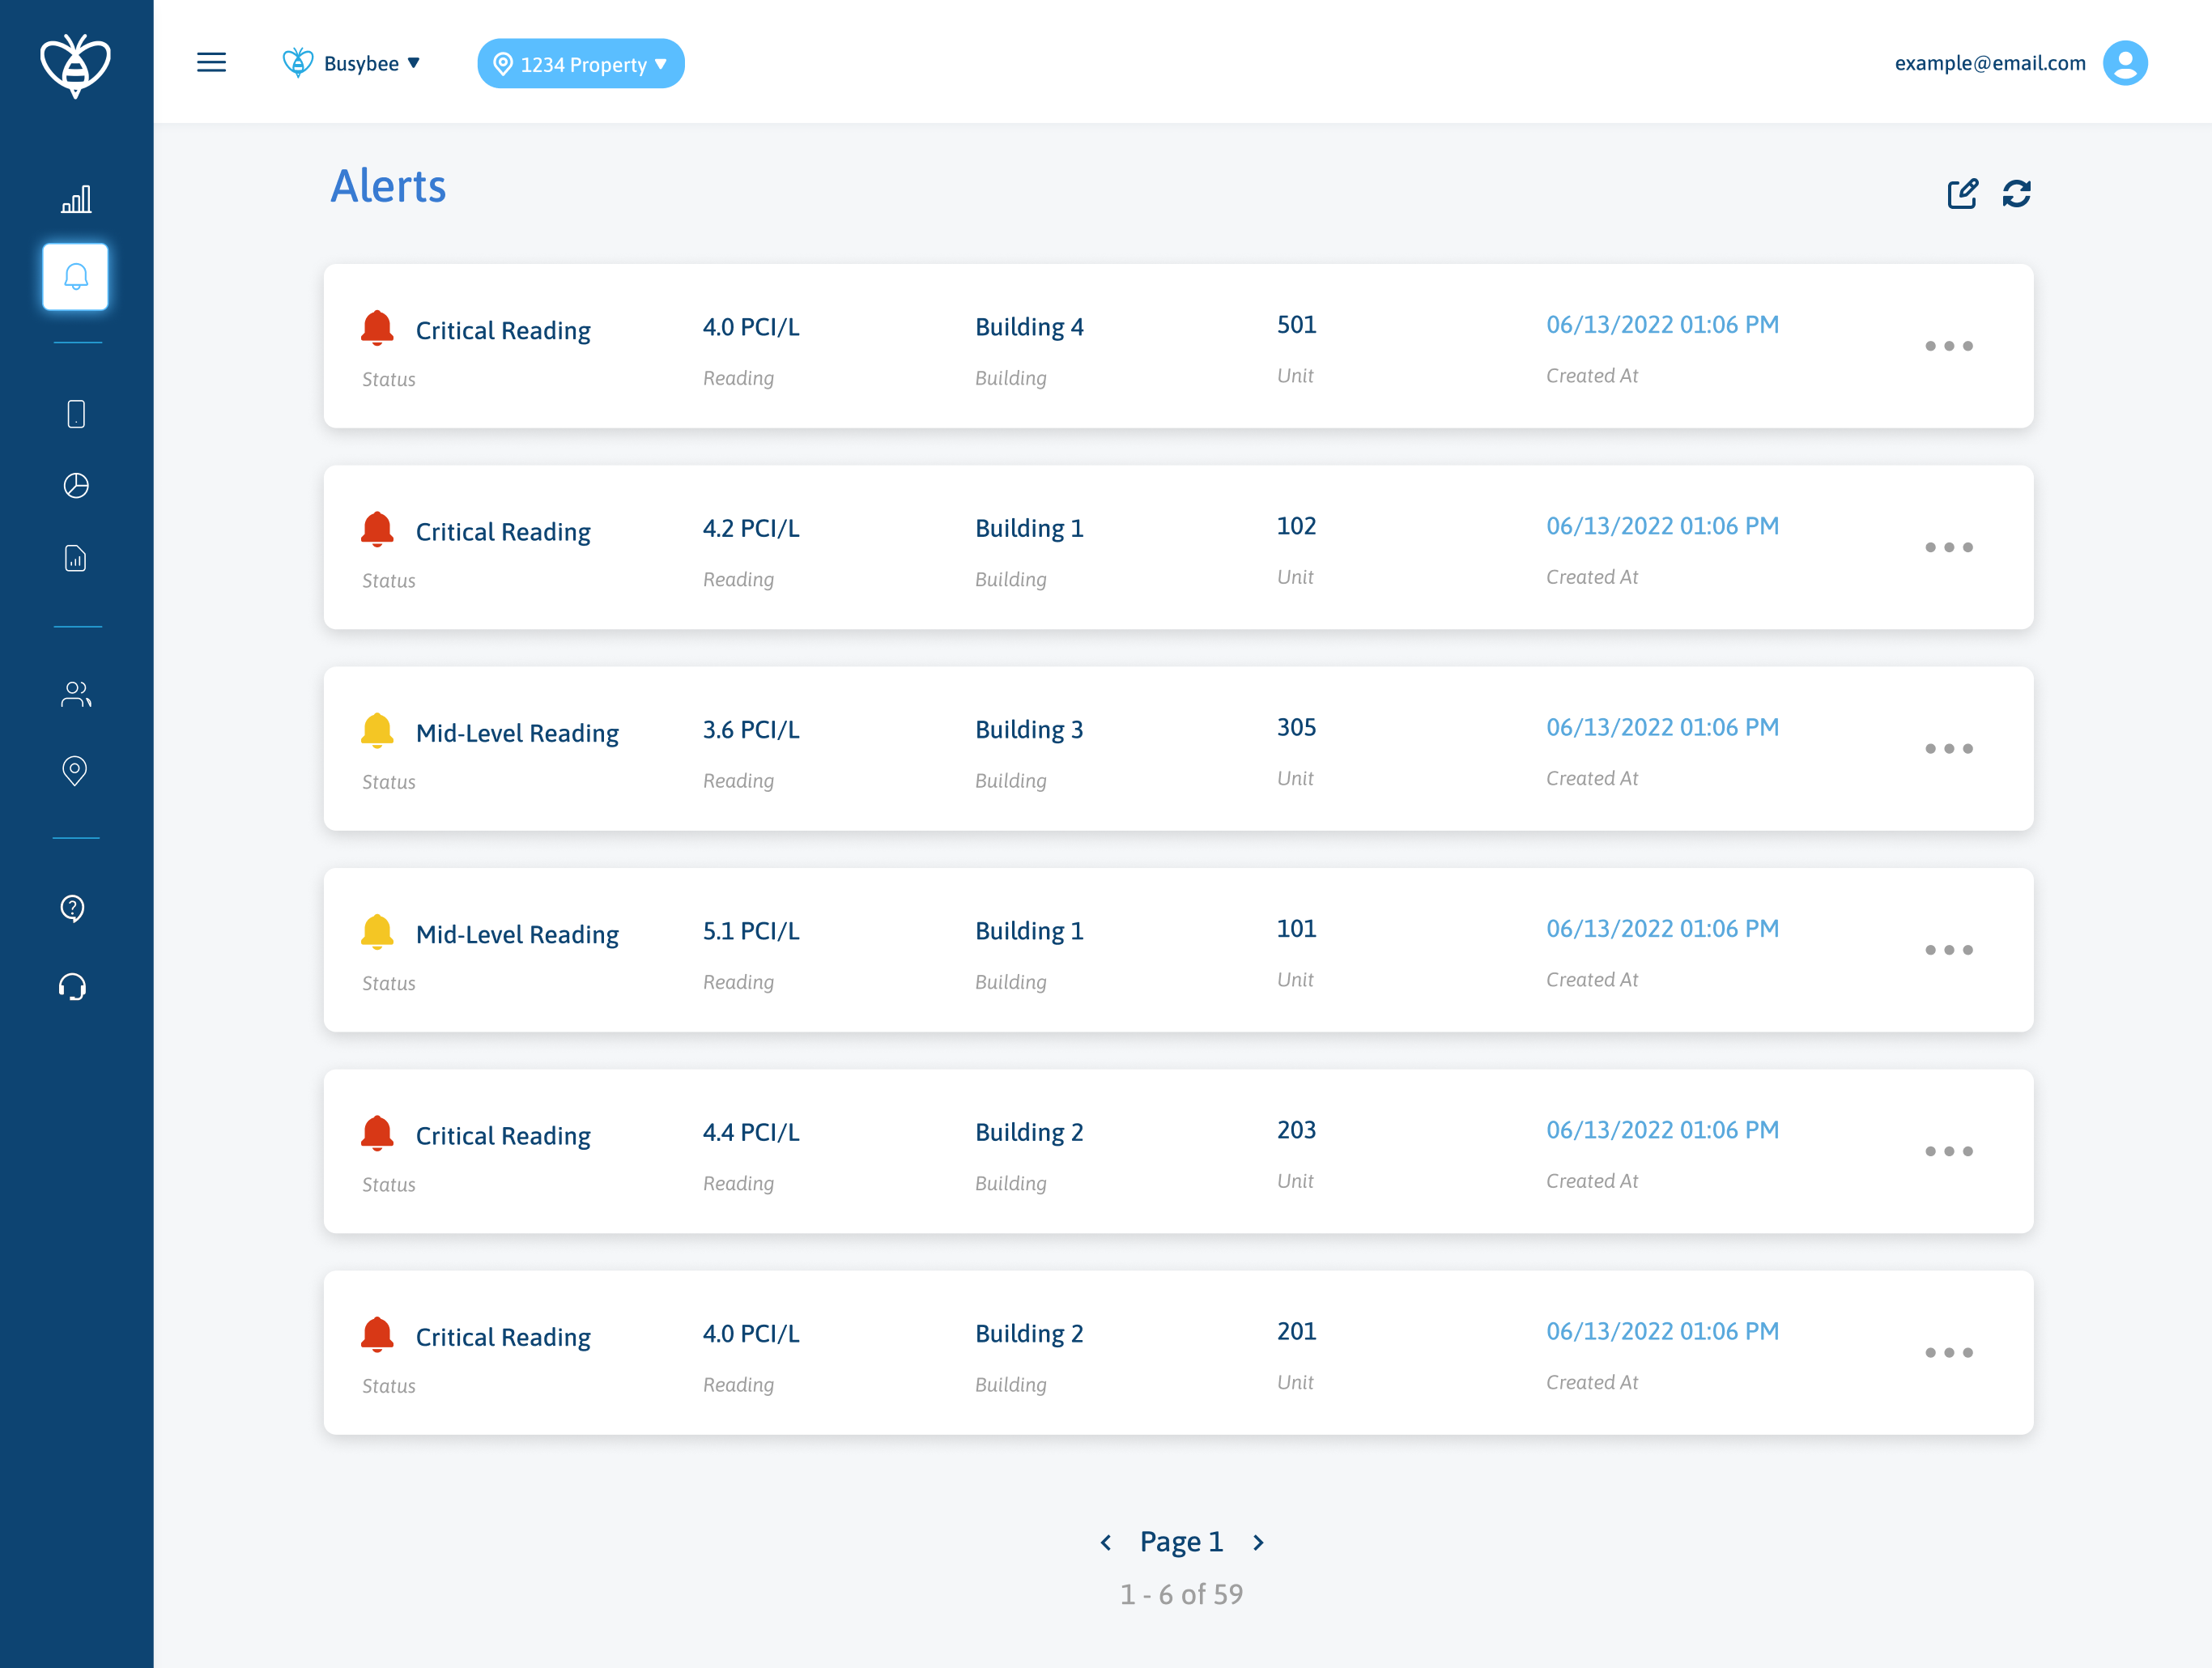
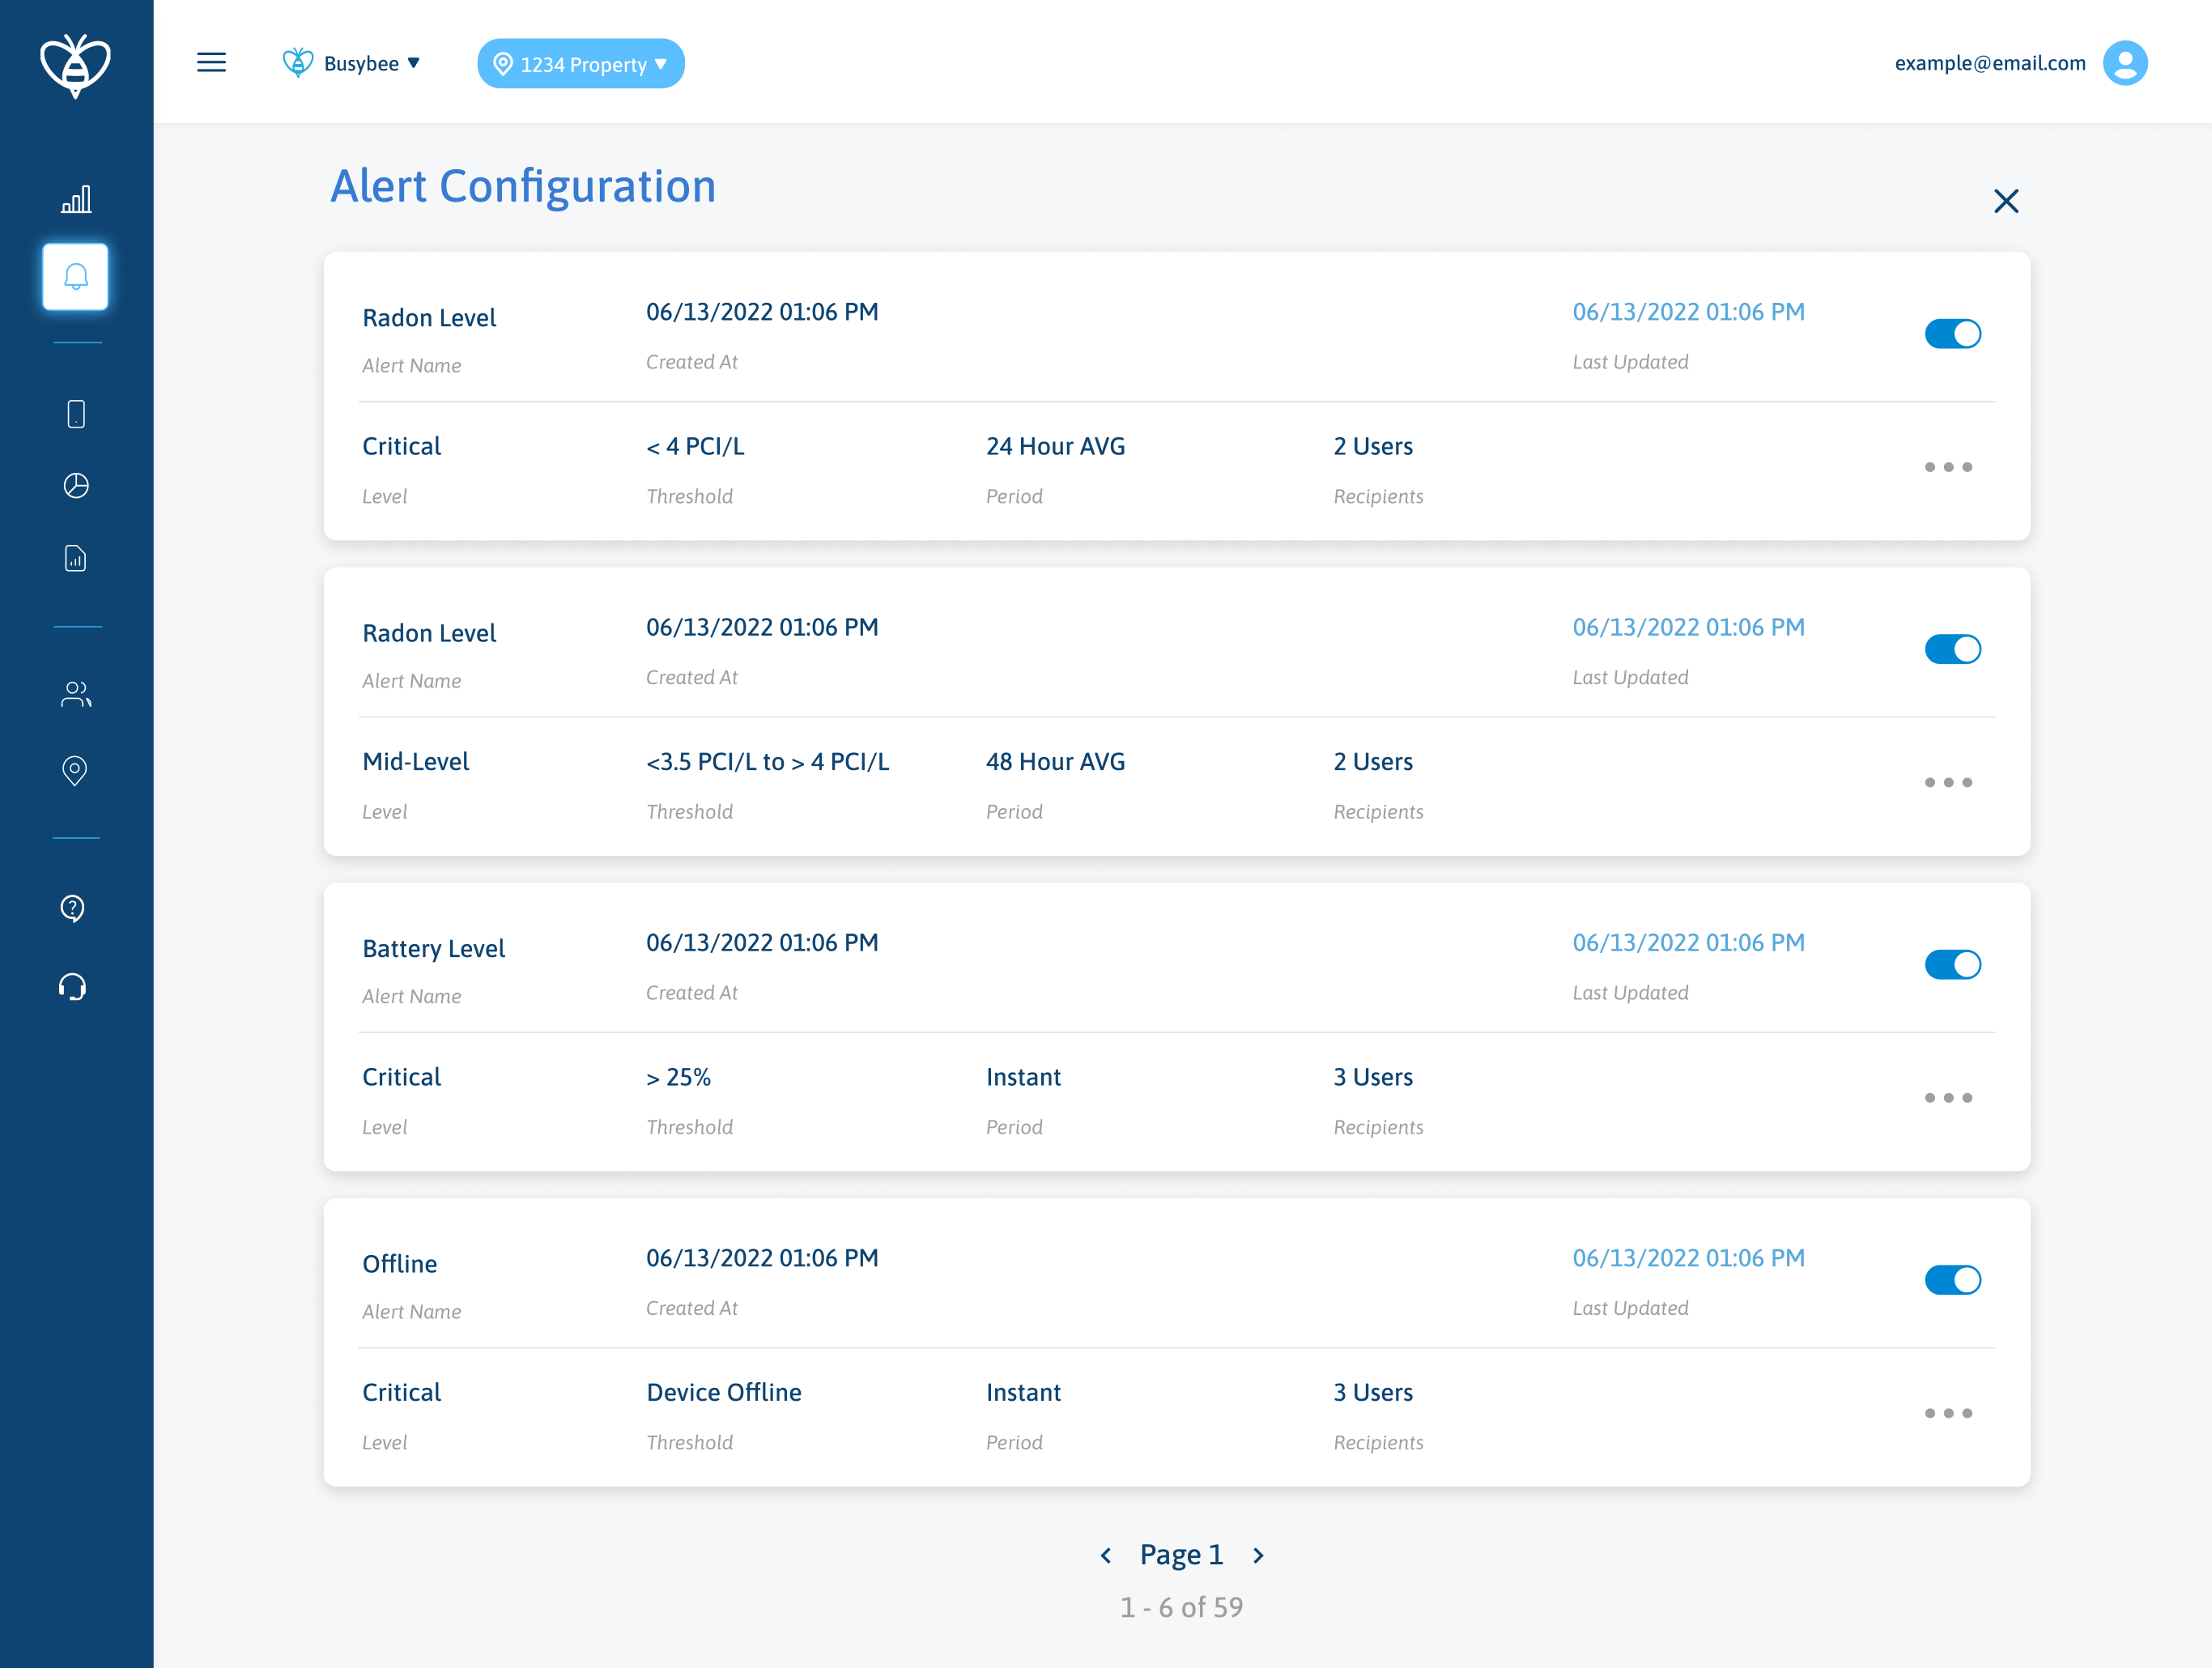
Dynamic Alerts
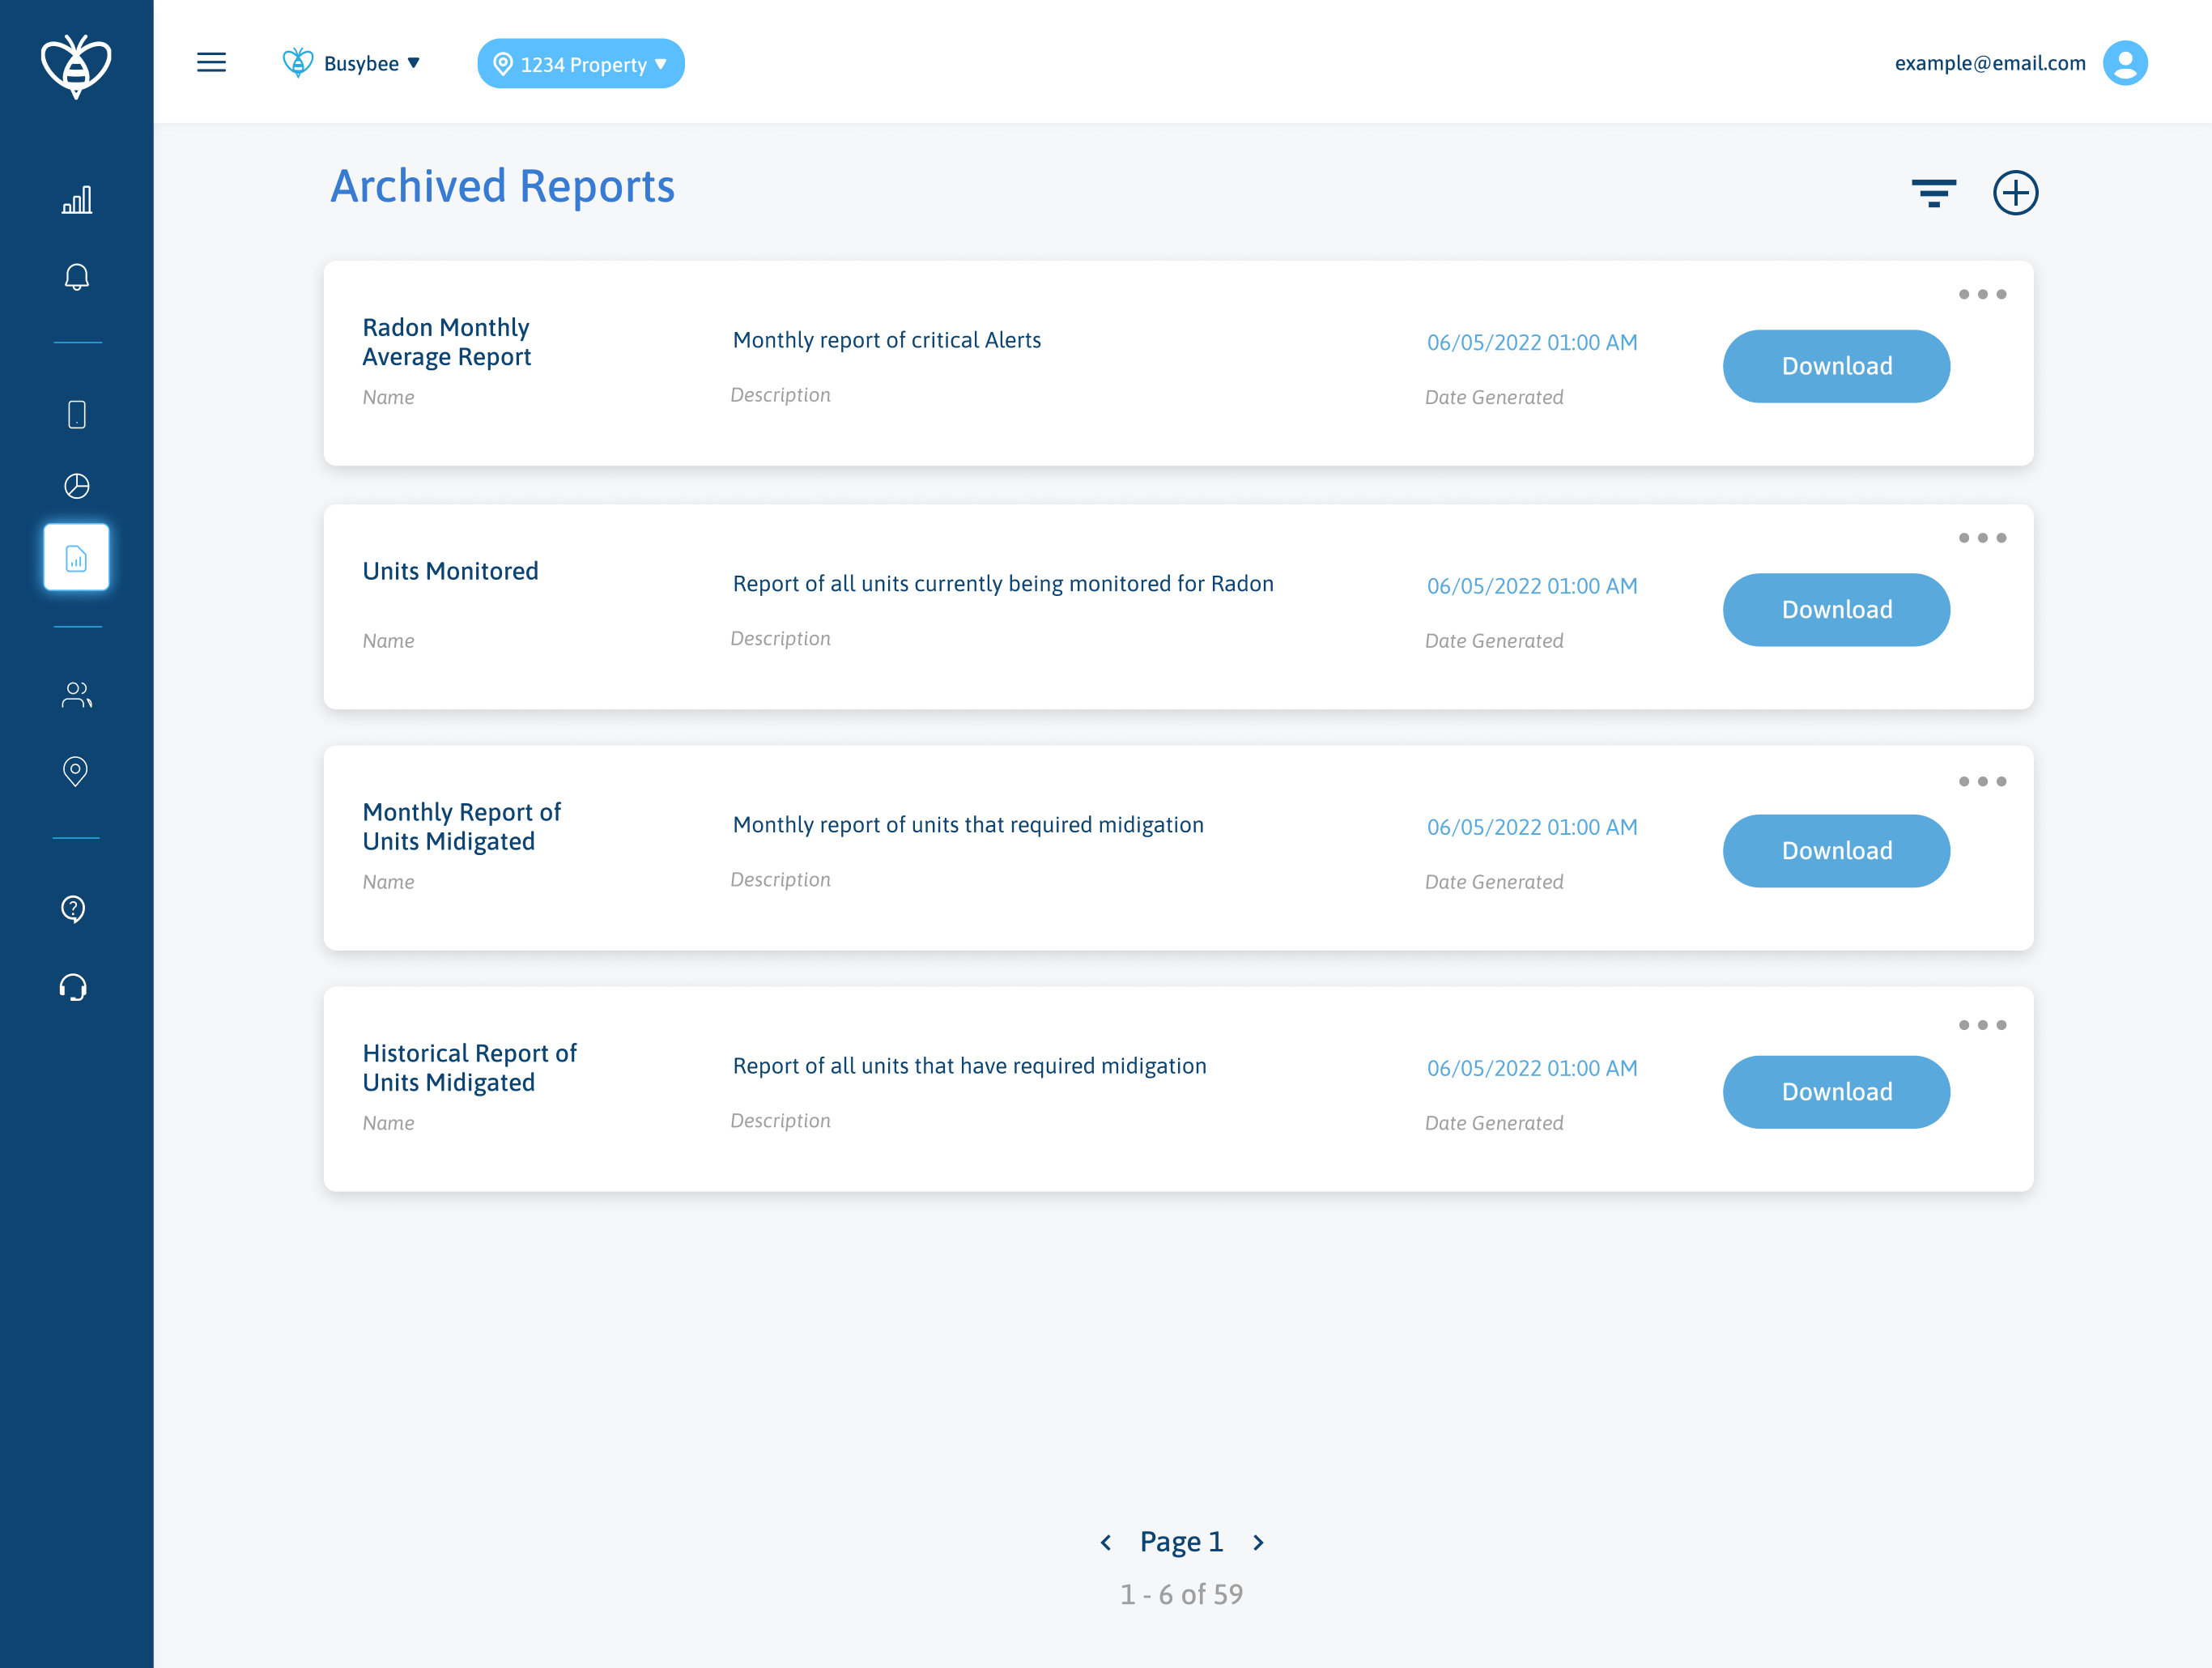
Customizable Reports
Live Analytics
SOLUTIONS
What Were SomeChallenges and Key Moments?
Key Moments
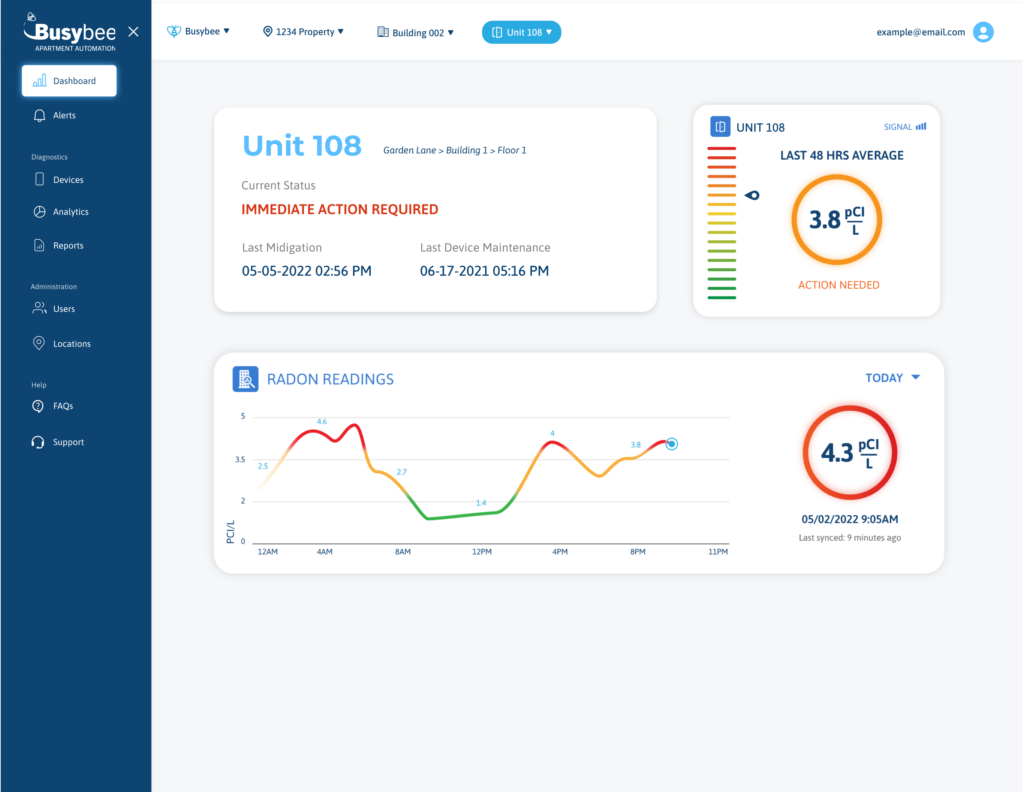
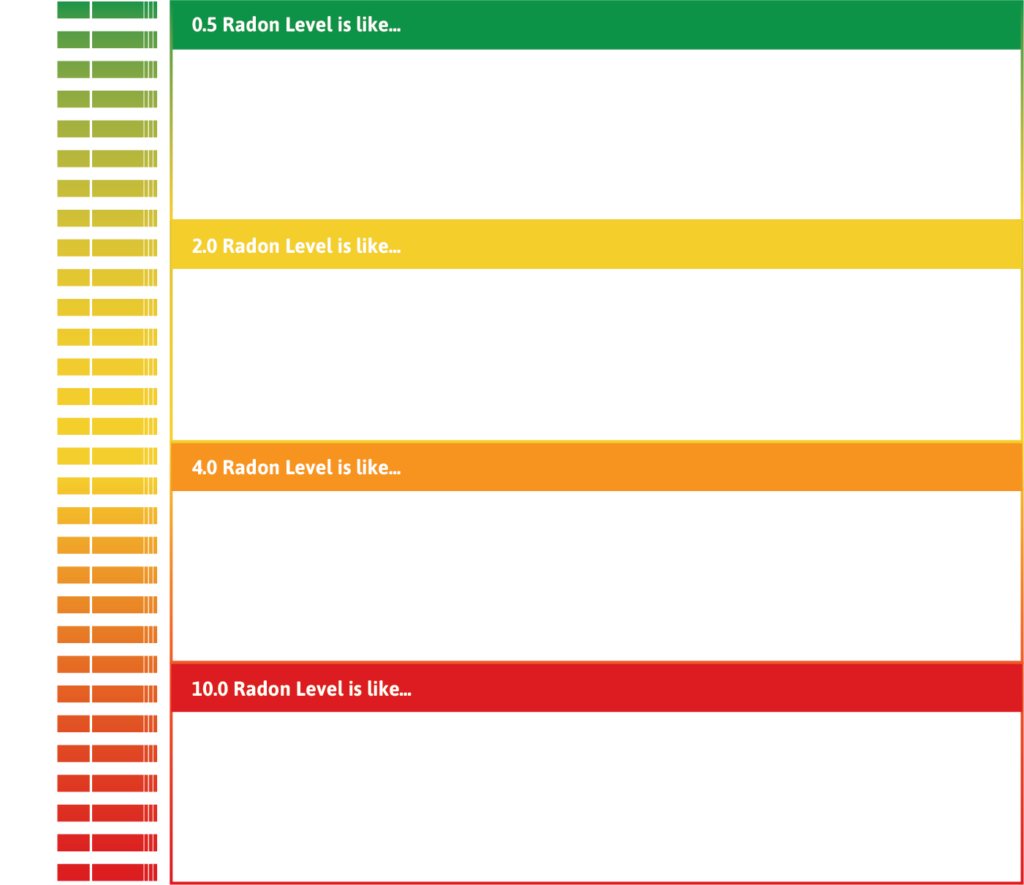
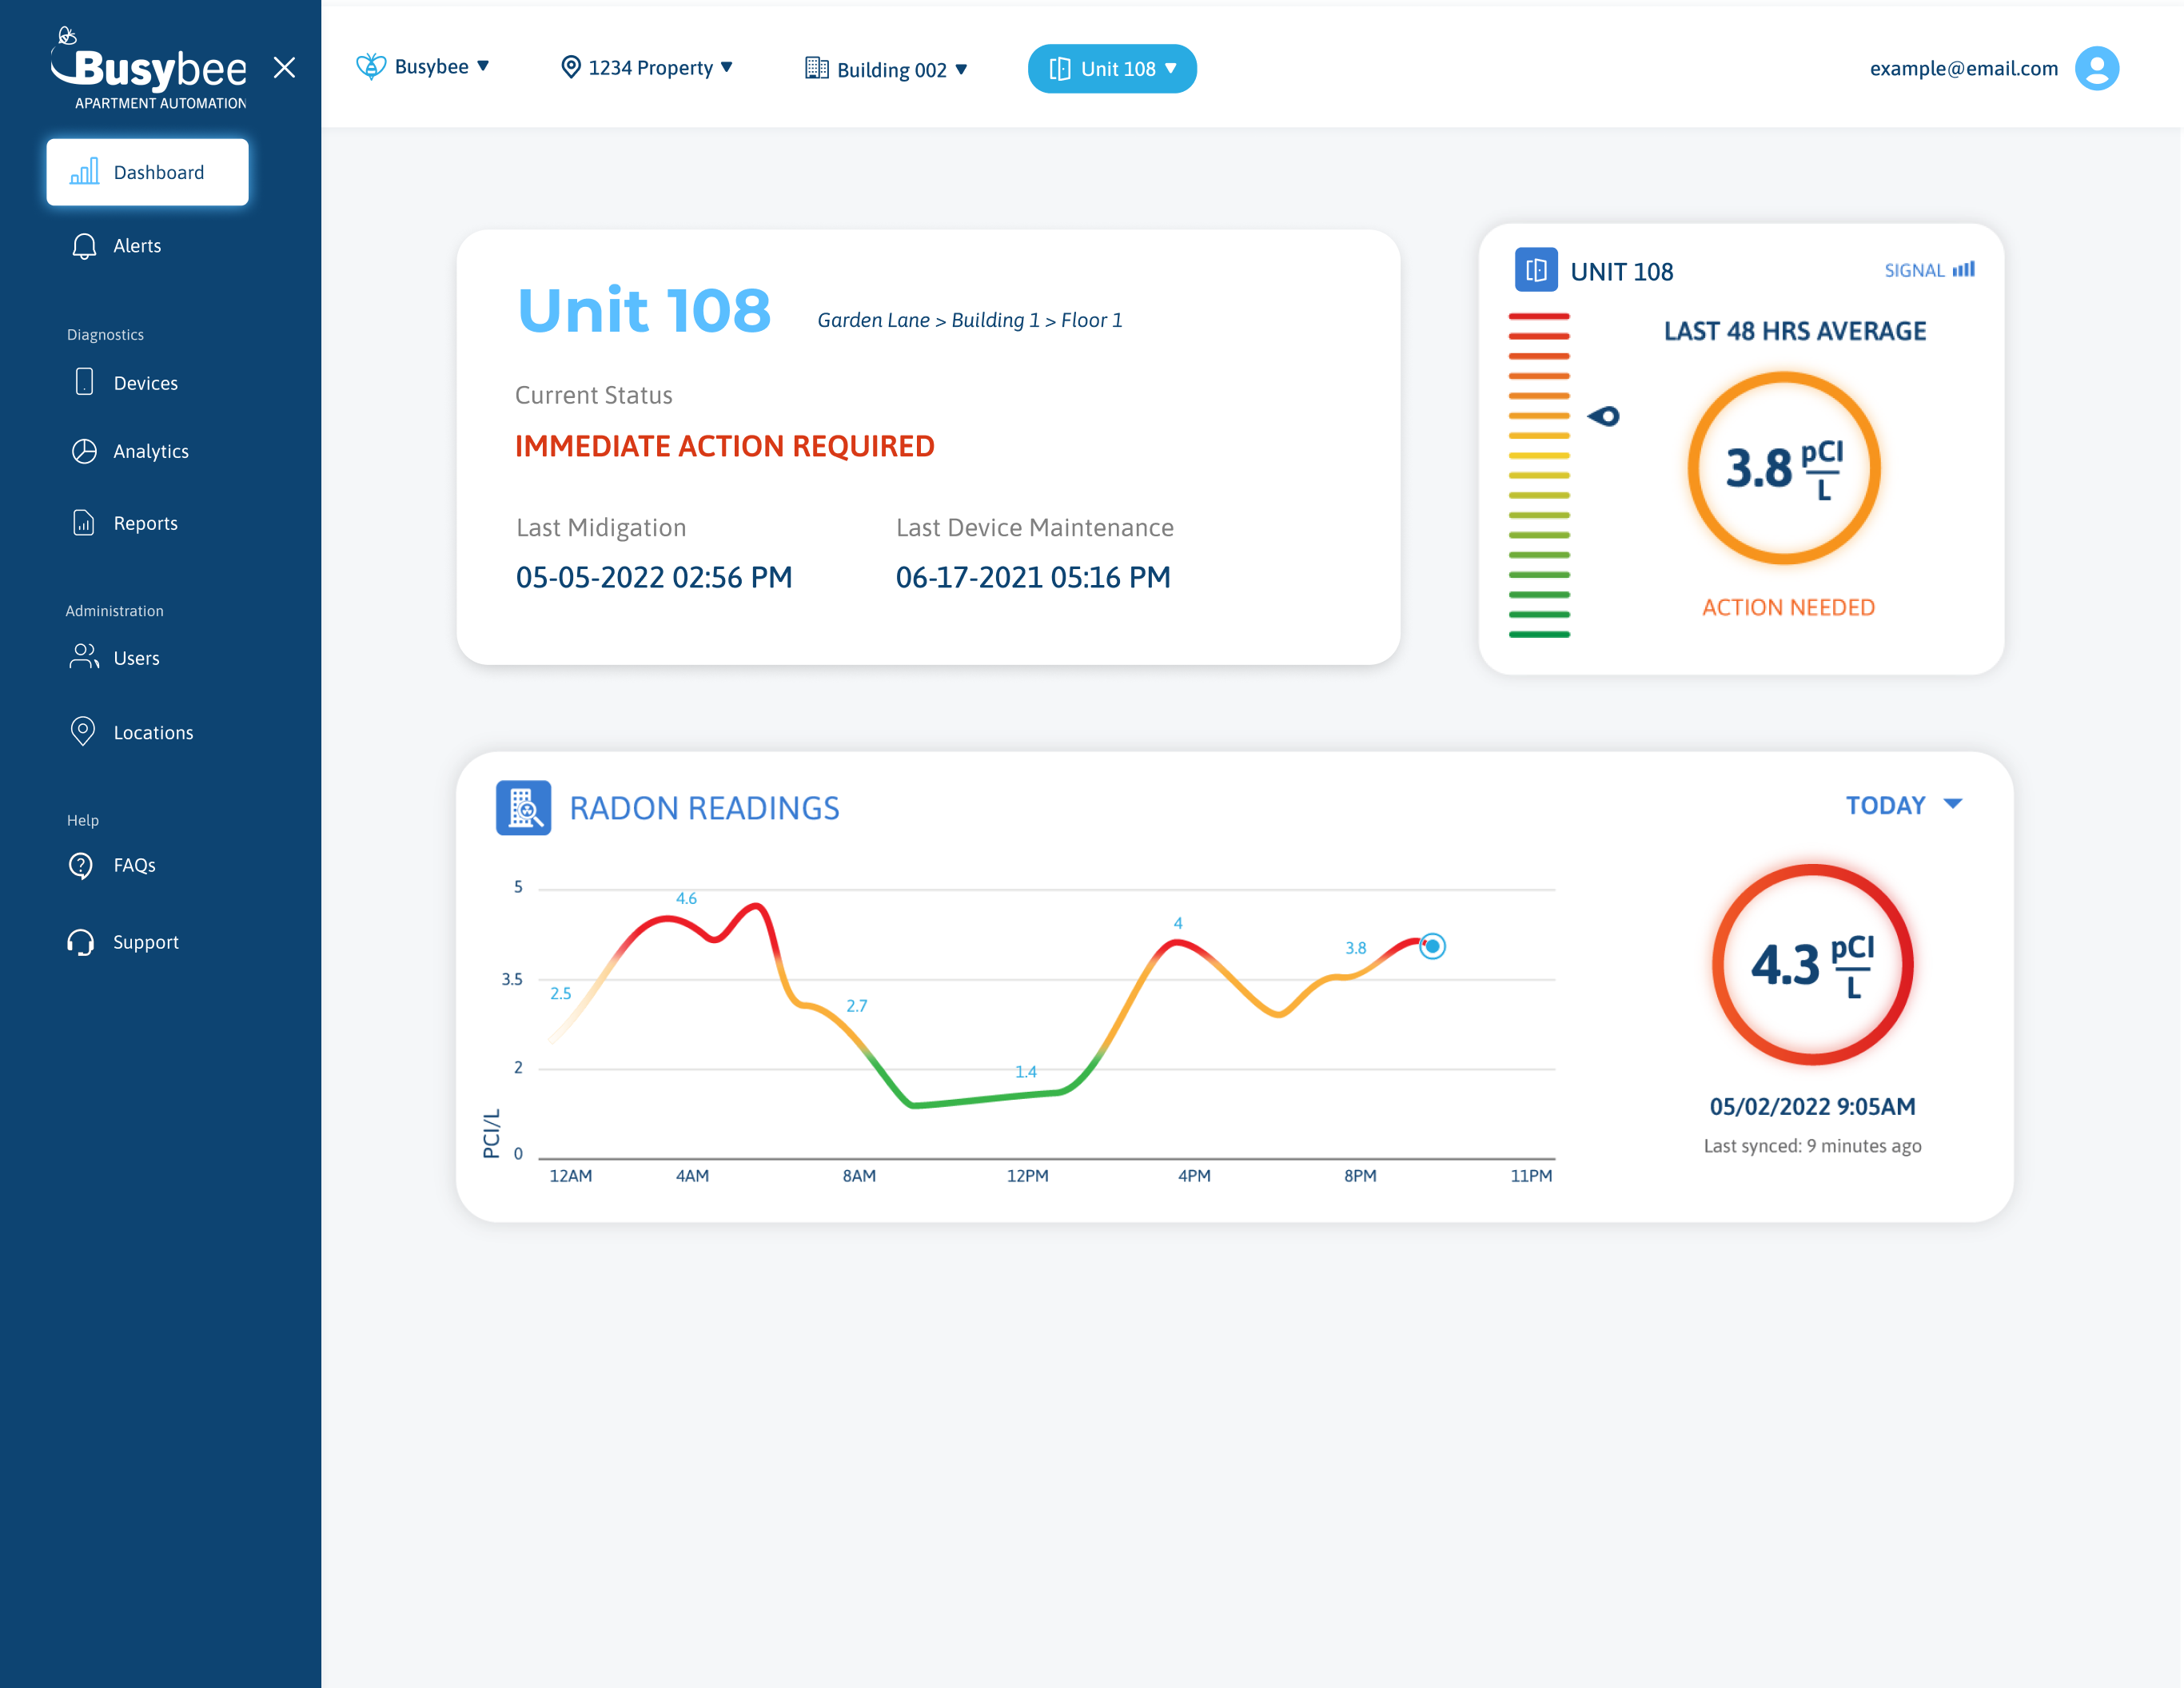
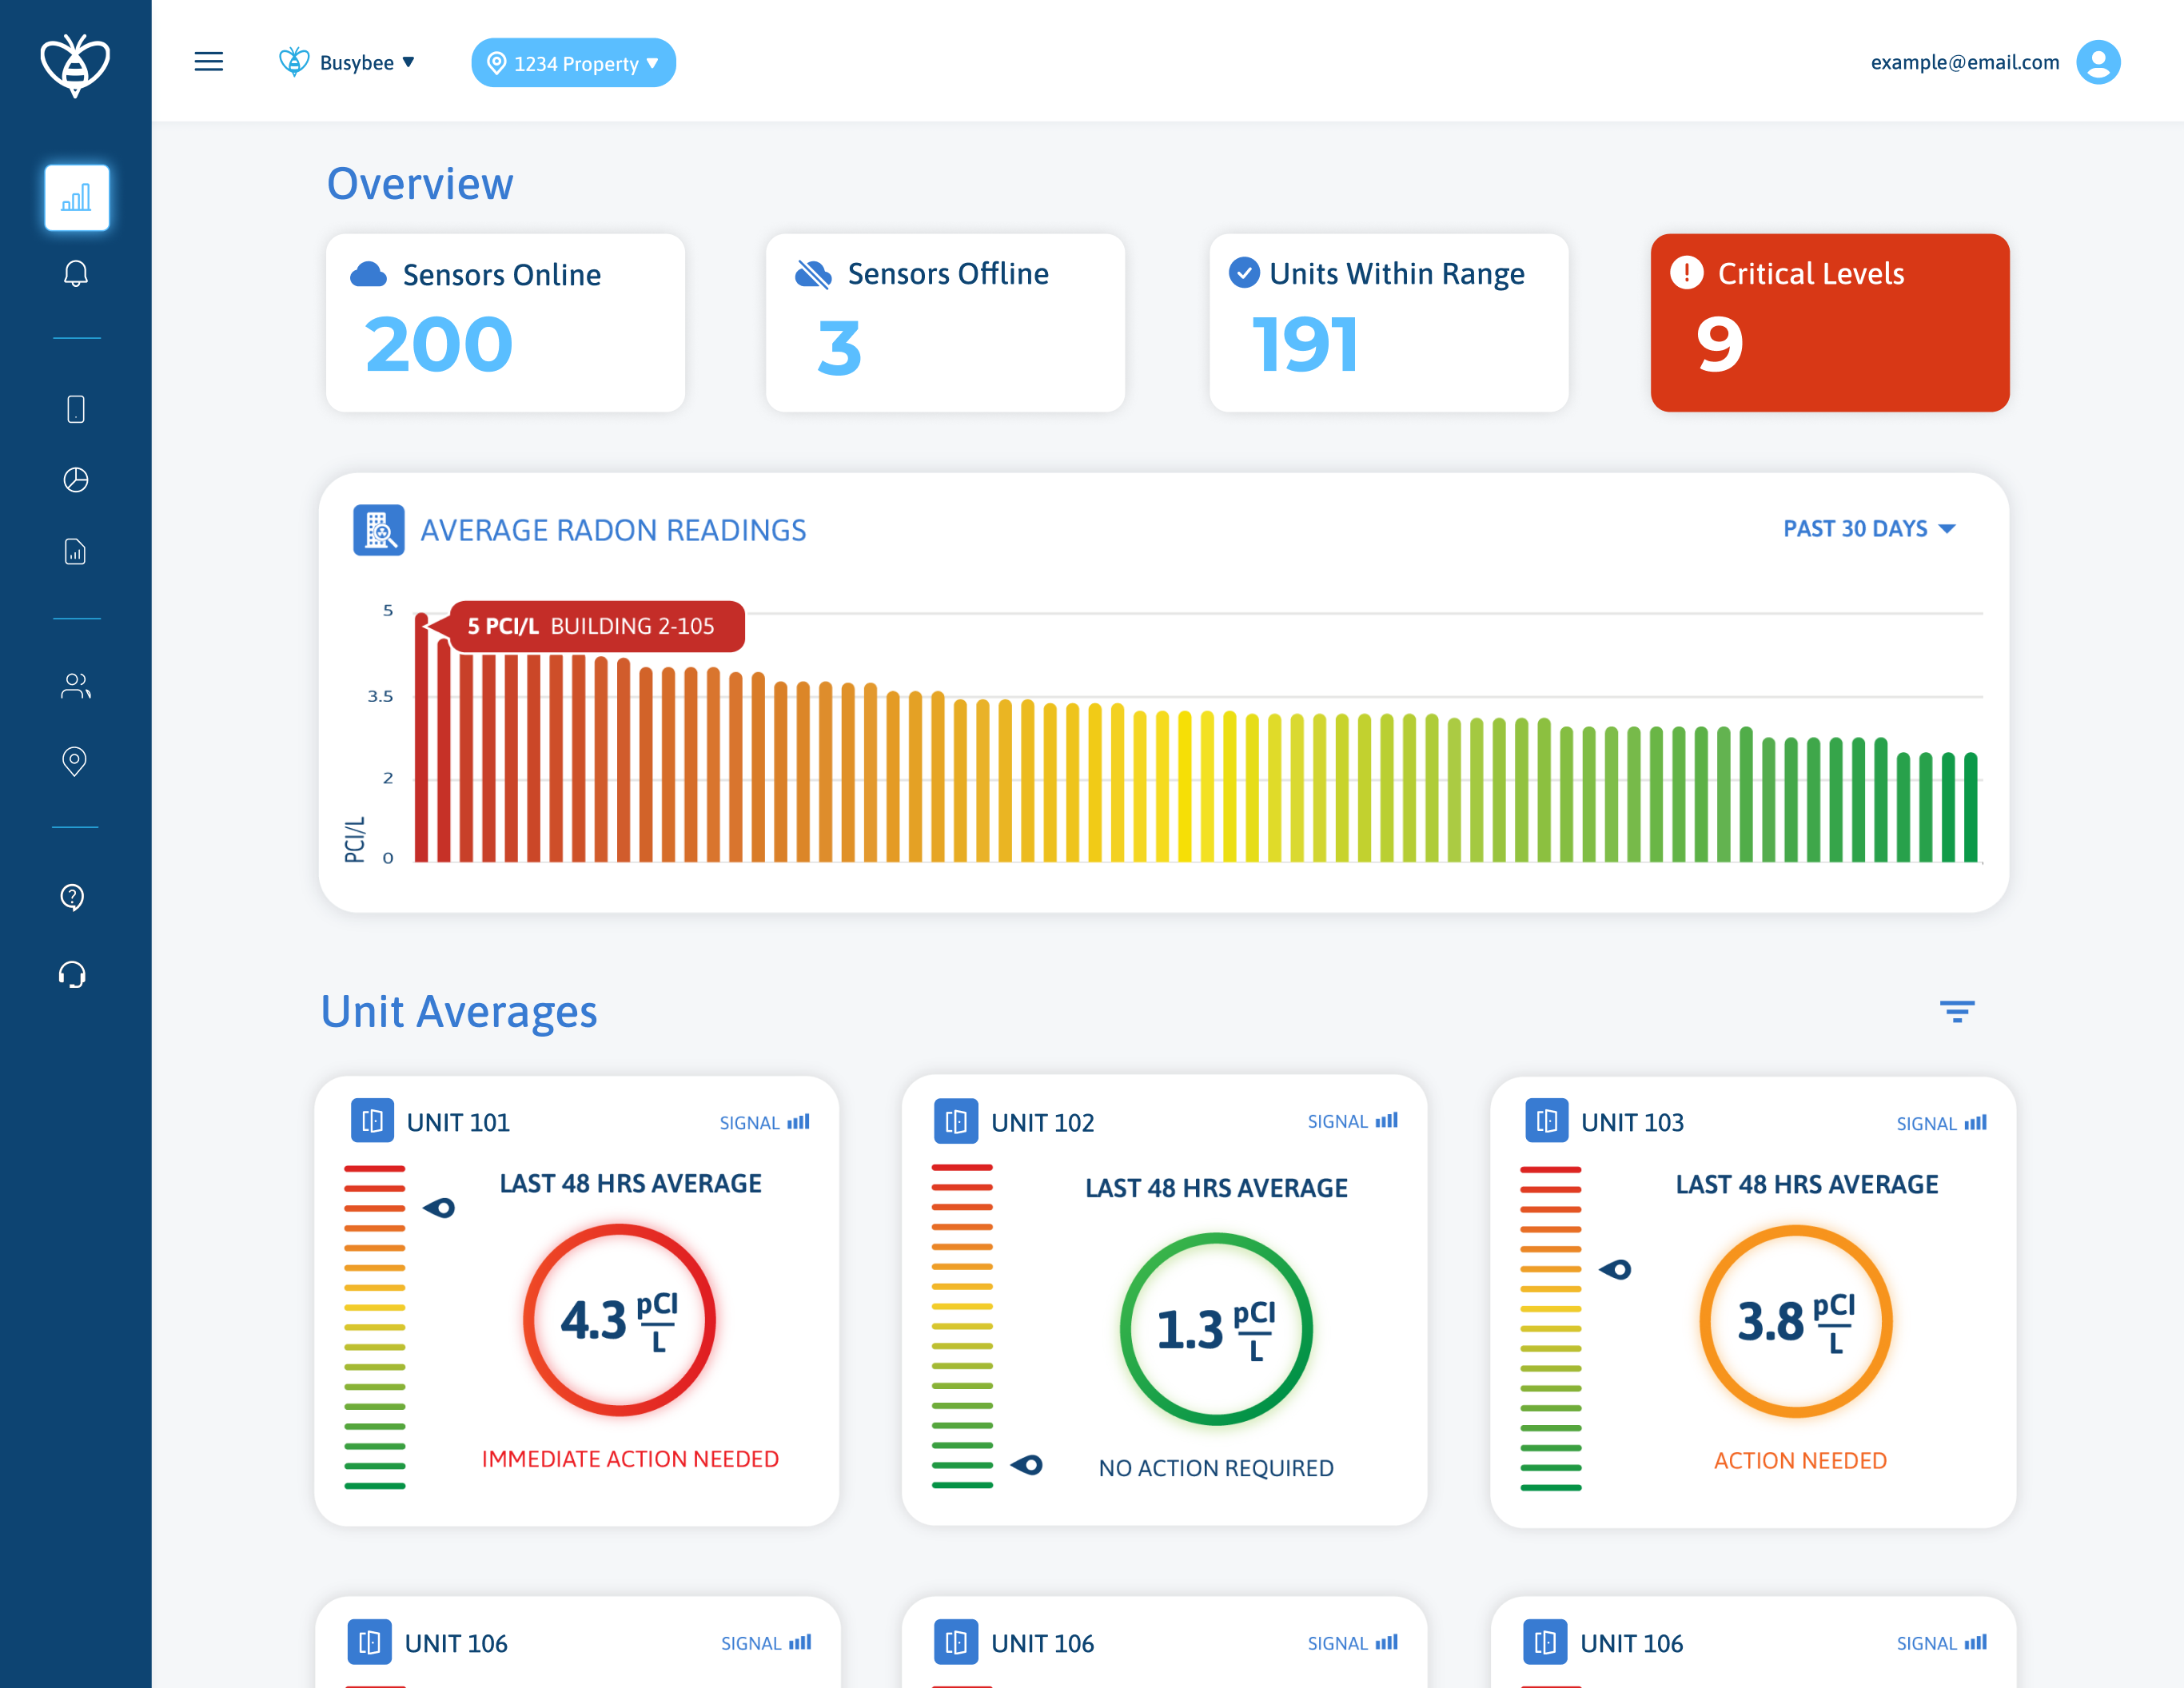
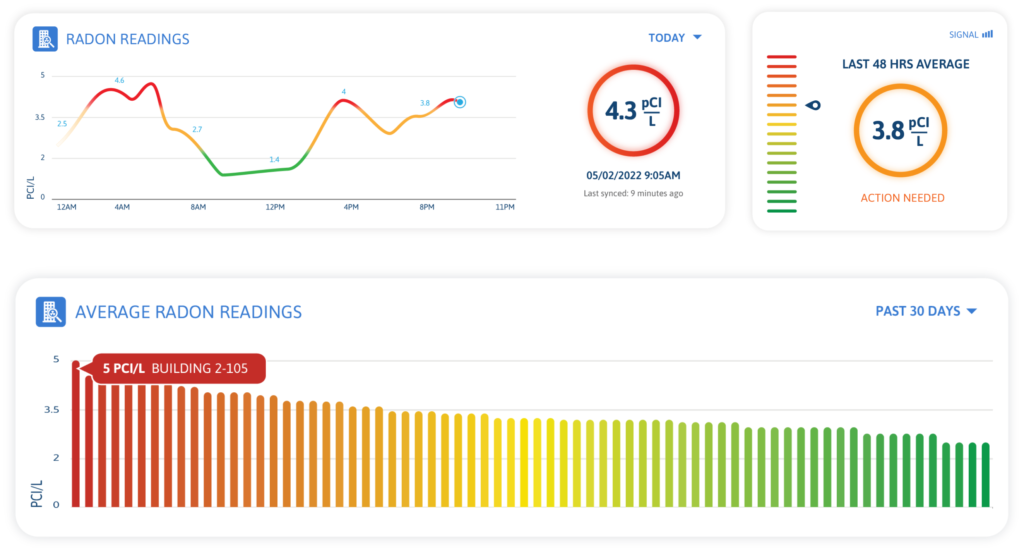
Radon Average Charts
The main pain point for many users was that they didn’t understand what the state-mandated reports meant. We needed to communicate the radon averages in an accurate and visually compelling way. By utilizing color, we were able to visually portray when levels weren’t within a safe range.
Key Moments
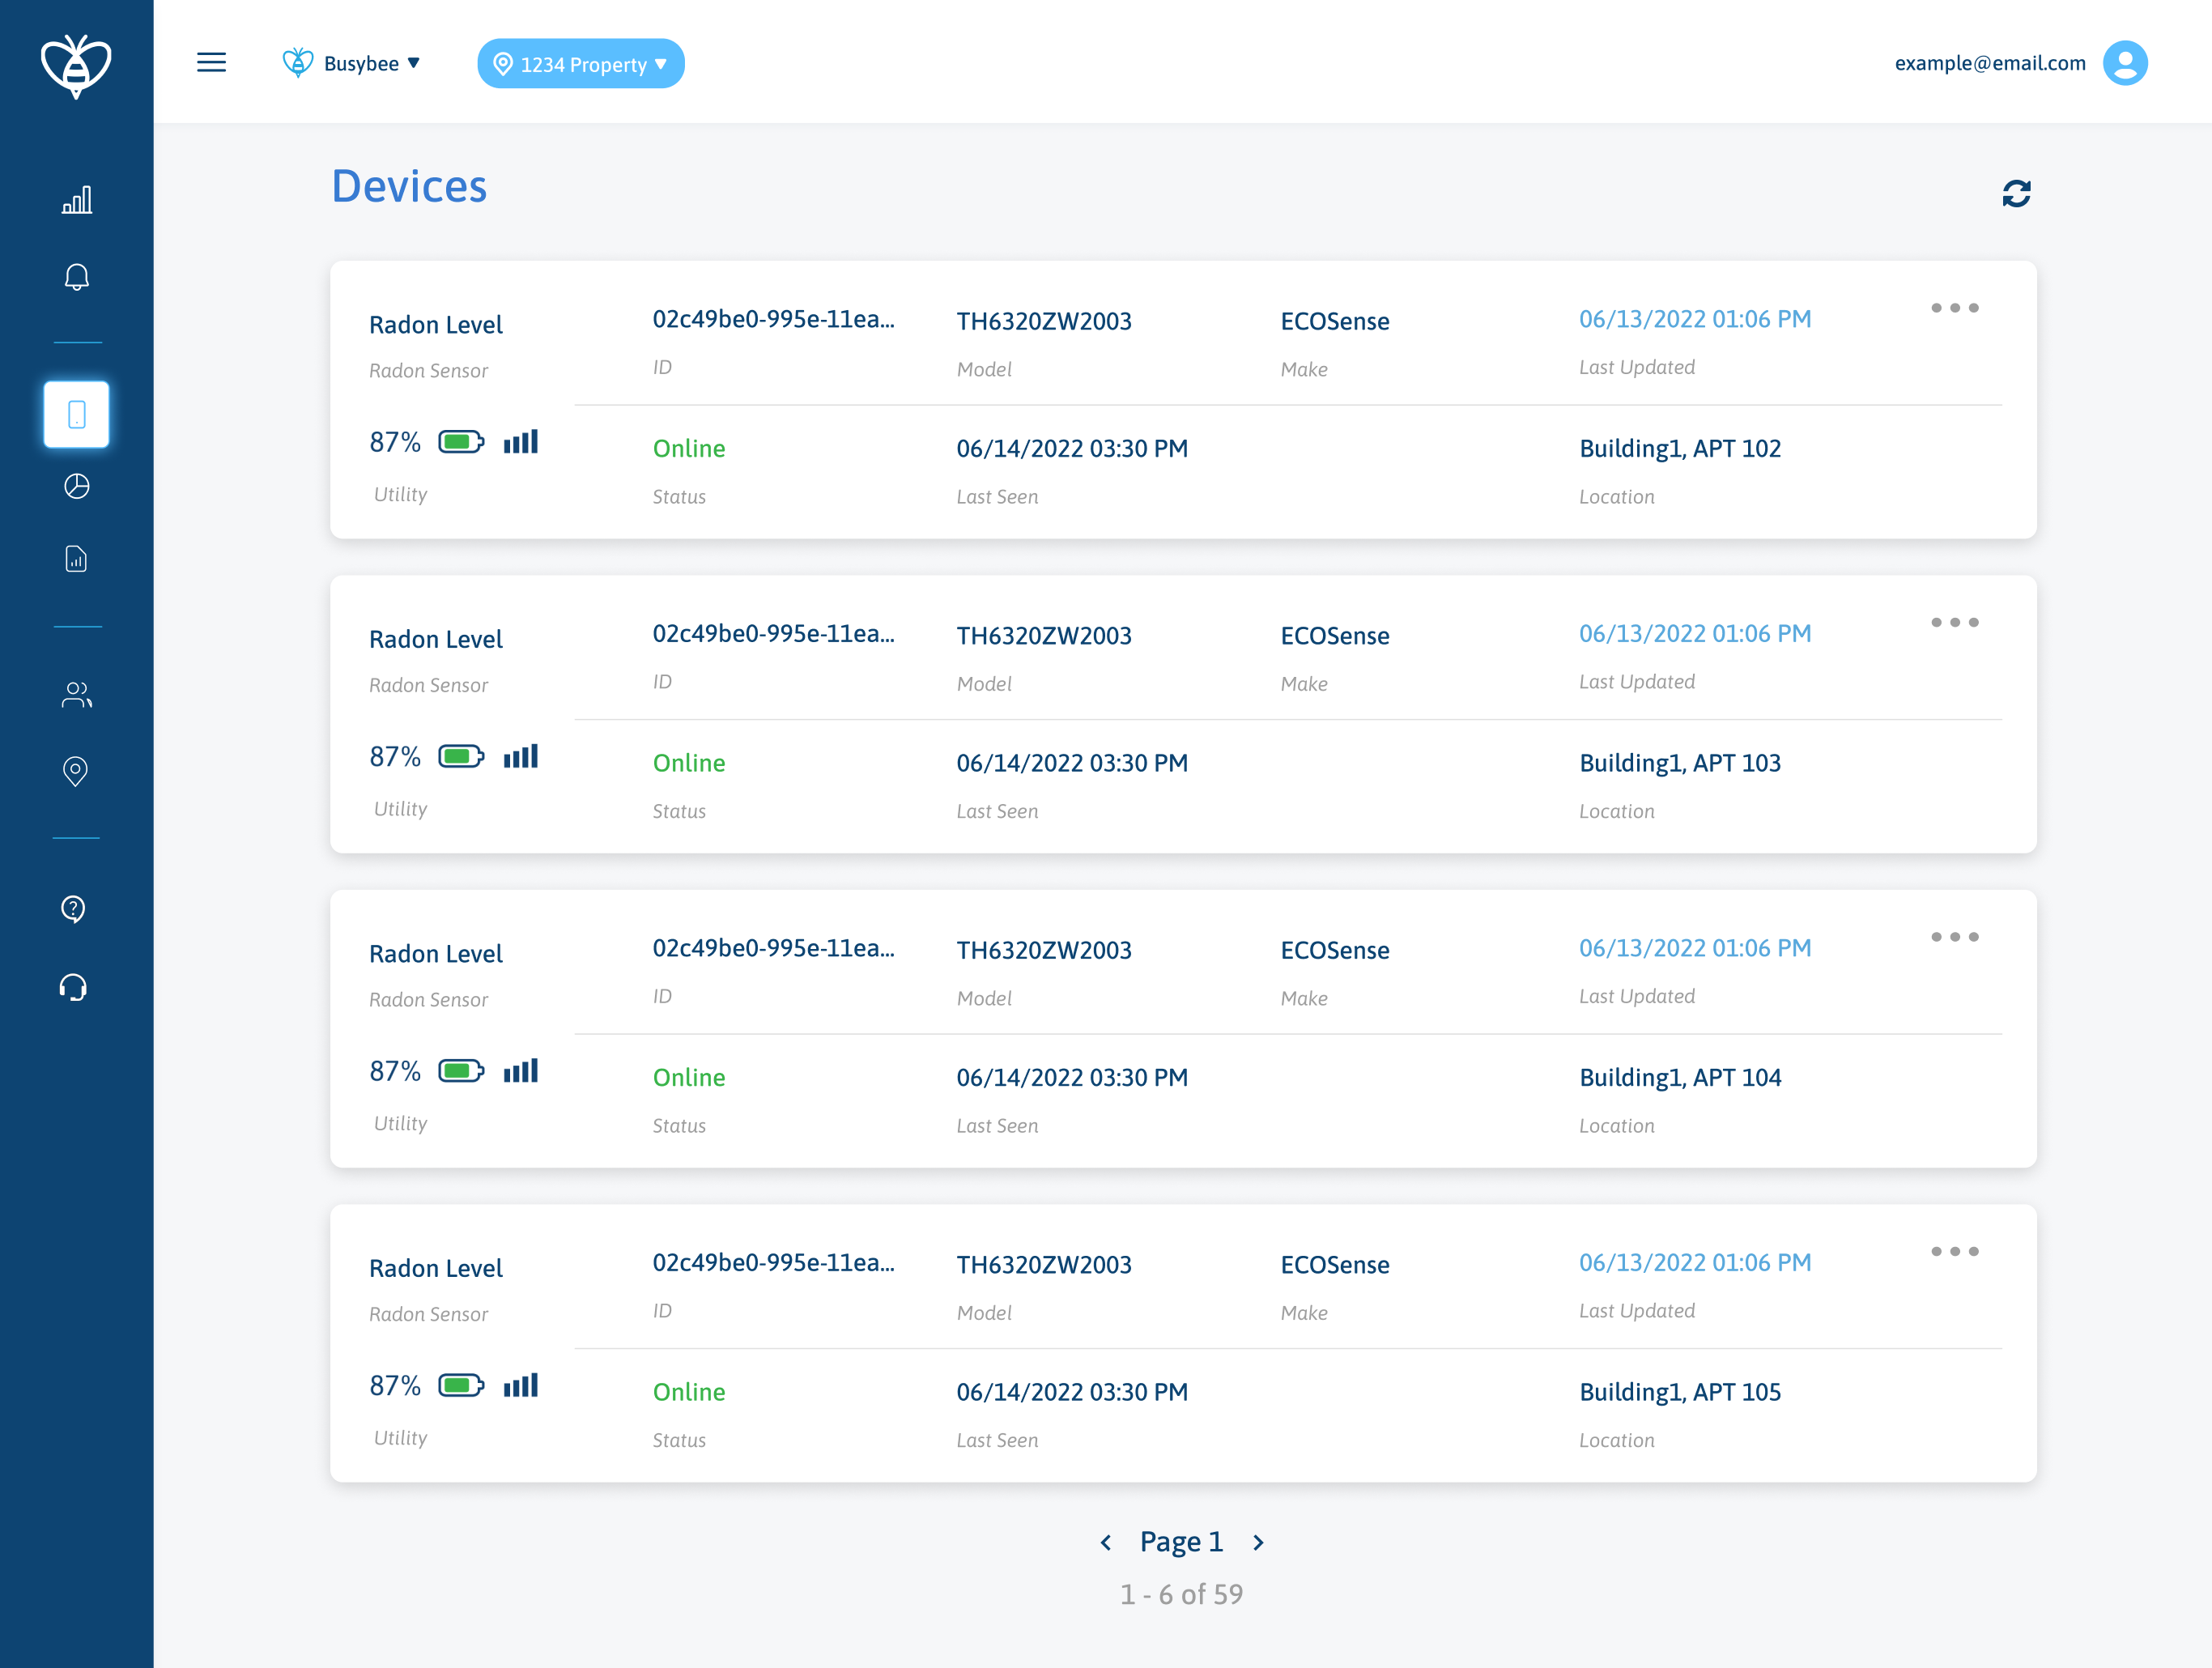
Breadcrumb Top Navigation
Users needed an easy way to navigate throughout the property to pinpoint specific units when necessary. By utilizing the top navigation they can narrow down the analytics and data by property, building, and unit.